A couple years ago, and more recently as part of our Sigma Operations Performance Group, I visited the Furniture Mall of Kansas (FMOK). This fifth generation, five store retail operation provides a unique service. Like all successful retail organizations, the company’s management is committed to continuous improvement. One takeaway from the visit to FMOK was how it uses the power of product family reporting. Family reporting combines the sales of all items in a collection (a family) together to determine if that family of products is earning its keep. For example, it’s important to know if the sofa on your showroom floor is turning as shown, but, it is even more important to understand how well the “Family” that sofa belongs to is doing. The family might consist of the sofa plus matching loveseat, matching chair, special ordered colors and special ordered sectional. In this article we will look at family reporting in more detail.
Case Study: Z-Stores
After my first visit to FMOK, I consulted with a furniture retailer we will call Z-Stores which produced about $20 million in sales volume. Z-Stores typically produced 45 percent gross margin and carries $5 million in inventory on average. Their overall business is decent but not performing up to its potential for a number of reasons.
Its margins were stagnant. Z-Stores could not get above 45 percent even after experimenting with multiple pricing strategies. Their salespeople constantly complained about not having the product their customers wanted. They were often out of stock in their top selling items. This led to a constant state of disarray at Z-Stores’ showrooms with too much dog-merchandise that did not sell despite aggressive markdowns. Eventually, Z-Stores held frequent massive liquidation-type events geared towards cleaning out old inventory. This presented a huge challenge for Z-Stores regarding proper display. As well, cash flow during the year had extreme peaks and valleys due to fluctuating inventory levels.
An analysis of this situation pointed to poor business systems and processes as the main cause. Specifically, systemic problems with merchandise had produced unfavorable results. Z-Stores needed a plan to increase sales, maximize margins, and stabilize cash flow at higher levels.
Something had to be done to increase their GMROI, which was stalled at 1.8. The formula for GMROI is Gross Margin Return on Inventory = GM $ / Inventory $. In this case, $20 Million x 45 percent GM / $5 Million. That meant that a dollar of inventory invested produced a $1.80 return. From that $1.80, Z-Stores had to pay for all operating costs and produce profits to generate cash in the business.
Family Reporting Tactics
To actualize the desired outcome, product family reporting became Z-Stores’ change engine. Here is a summary of the tactics used.
Tactic #1: Understand and implement the methodology of “Family Reporting.”
In retail, effective product line-up management is where all merchandising needs to start. Before family reporting, Z-Stores had lists of items and miscellaneous pictures posted all over their office walls. Management believed that this system helped them to understand which items were selling, whether they had any in-stock or on-order, what it looked like, and where it was displayed. Also, which items were not selling and needed to be dropped. They constantly battled with how many of these items were being special ordered and which inventory SKUs those sales were coming from.
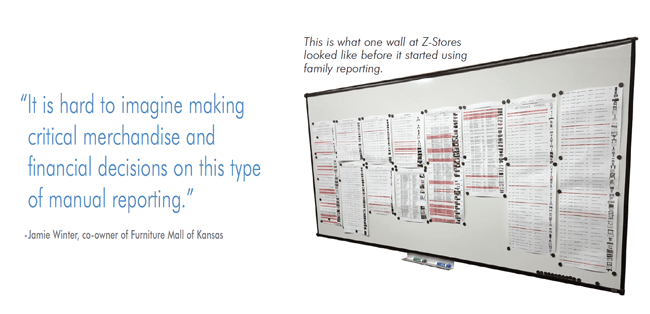
Commenting on the malfunctioning system at stores similar to Z-Stores, Jamie Winter, co-owner of Furniture Mall of Kansas said, “Special orders can be a significant portion of a store’s business but matching a special order back to the exact group on the showroom floor that generated the special order can be challenging.”
See the image above of what one wall at Z-Stores looked like before family reporting. Jamie stated, “It is hard to imagine making critical merchandise and financial decisions on this type of manual reporting.”
Enter Family Reporting
Constant review of the stock levels and rates of sale for the most important families allowed for a smoother flow of merchandise and fewer stock-outs. |
As mentioned previously, family reporting is the systematic grouping of items with like-frames together. For example, Z-Stores offered an upholstery collection of items called the Napa Collection, shown on the retail floor as sofa model #500-01 Fabric Y, loveseat model #500-02 Fabric X, chair model #500-03 Fabric S, ottoman model #500-04 Fabric Y, and several other items. The Napa Collection was customizable, with any item in the collection available in numerous fabric colors, grades and add-on options. Z-Stores could only show a few of the thousands of available configurations of the Napa Collection on their floor at any given time. Their management software system included a SKU for any item in this collection displayed or carried for stock. Since it was impossible to create SKUs for all the thousands of possible permutations and combinations, salespeople used miscellaneous SKUs whenever customers wished to customize orders, which was often.
Z-Stores came to realize that what really matters for the purpose of inventory management is how the family or group of items in the Napa and other collections performed. “Although the specific configuration and color combination on the sales floor may not sell very often,” continued Jamie Winter, at Furniture Mall of Kansas, “if it is generating significant special orders in different fabrics and different configurations, the family is working and earning it’s spot on the floor. If a family produces a bigger proportion of revenue at a decent margin with the appropriate quantities, it naturally yields a higher return on investment.” Those families that are productive deserve floor space. Table #1 shows a sample of Z-Stores’ data in the type of automated family report format used by Furniture Mall of Kansas, summarized with important information such as product snapshot, sales, margin dollars, margin percent, and quantities in stores and their DC.
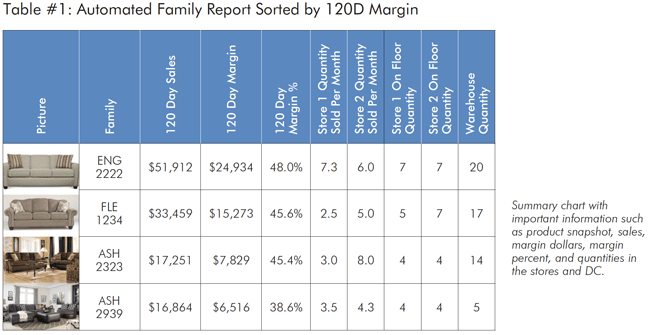 Sample report (above) shows items in the Napa Collection family in it’s expanded form. As you can see, there are a significant amount of special orders contributing to total sales. |
Table #2 shows a sample list of items in the Napa Collection family in it’s expanded form. As you can see, there are a significant amount of special orders contributing to total sales based upon the few items actually shown on the showroom sales floor.
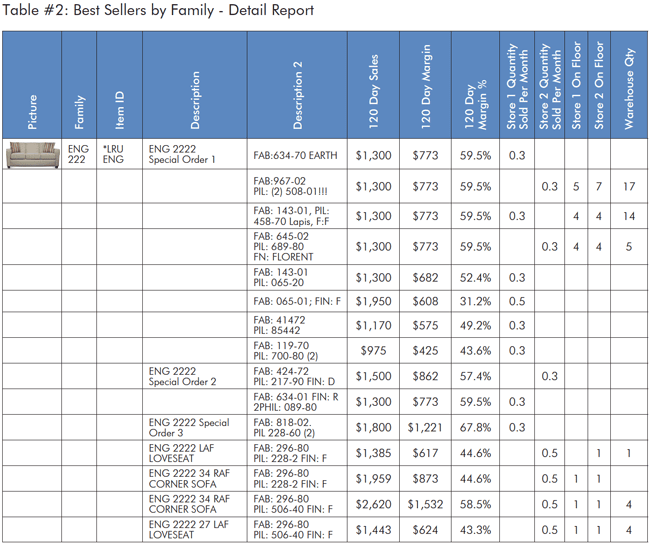 Sample report shows items in the Napa Collection family in it’s expanded form. As you can see, there are a significant amount of special orders contributing to total sales. |
Tactic #2: Give more floor space to vendors with more productive families
Family reporting needs to be dynamically connected to a database so real-time information is automatically compiled. Z-Stores’ old reporting system created a time-lag between the re-printing and re-posting. It was always out of date. By updating their systems and moving to family reporting they were able to access their data for timely decision support.
Jamie Winter explains, “Once you have all this information compiled real-time and automatically, it becomes a fantastic tool to look at return on investment by category, by vendor, and then, by family.” After switching to family reporting Z-Stores was able to easily review the amount of floor space allocated to vendor lines. Wisely, they chose to expand the lines that generated higher returns. This helped them to leverage the Pareto 80/20 principal, which states that the majority of results are produced by the minority of inputs. Giving more valuable space to best selling families of goods makes excellent business sense.
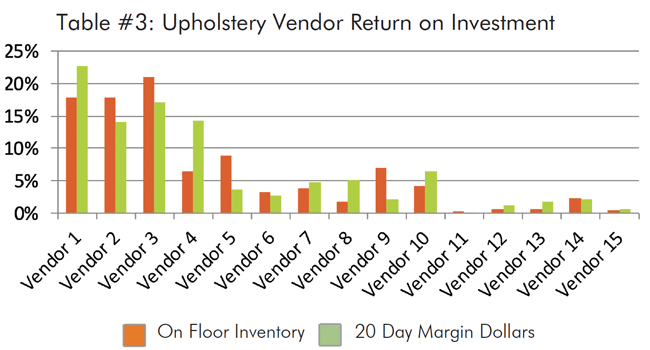 Vendor number one and vendor number four are OVER-performing, while vendor number two, vendor number three, and vendor number five are UNDER-performing. |
Table #3 shows a graphical tool format used by Furniture Mall of Kansas to determine which vendors are earning their keep on the floor and which are not. The orange bar represents the percentage of stationary upholstery located on the showroom floor by vendor. The green bar represents the percentage of margin dollars returned for that vendor. This presentation provides a highly visual analysis that facilitates retail decision making regarding floor space allocation for each vendor. Any vendor that has a green bar larger than the orange bar represents a vendor that is OVER-performing as the return is higher than the investment. Note that in Table #3, vendors number one and four are OVER-performing, while vendors number two, three and five are UNDER-performing. Jamie said, “It becomes extremely obvious to identify which vendors you should expand and which you should shrink or eliminate that are just not earning their keep on the floor.”
Tactic #3: Perform price point analysis to provide more options for customers.
With expanded family reporting at Z-Stores, it became easier to review and compare how display items were priced. This allowed them to provide customers with a wider variety of price/value options. Z-Stores could more easily identify opportunities to fill gaps in their line-up by shifting prices or selectively buying for a gap. This tactic enabled Z-Stores to realize previously untapped sales and margin dollars.
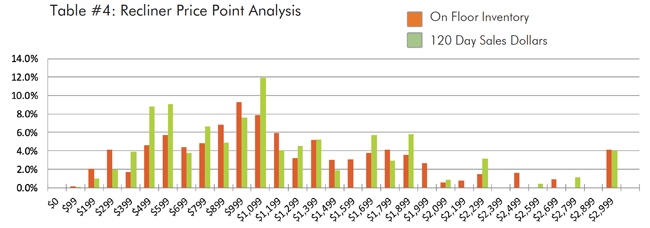
Furniture Mall of Kansas performs a price point analysis (similar to the vendor analysis in Table #3) that looks at their investment on the showroom floor vs. sales by price point. In Table #4, the orange bar represents the percent of inventory investment on the showroom floor by price point for the recliner category. The green bar represents the percent of sales by price point. By looking at orange vs. green bars, it’s easy to see that the $1,199 price point is UNDER-performing while the $599 and $1,099 price points are OVER-performing.
Tactic #4: Focus on top family items when re-buying stock.
Top turning items from top families at Z-Stores are now given priority when re-buying for stock. Non-special order items that customers purchase as displayed on the floor provide quick revenue when the supply chain performs well. Focusing closely on the families that produce margin dollars makes this process at Z-Stores more efficient because buyers do not have to look through pages of paper and hundreds of items. Constant review of the stock levels and rates of sale for the most important families allows for a smoother flow of merchandise and fewer stock-outs.
Tactic #5: Ensure top-quality display processes.
Prior to looking at merchandise in family groupings, Z-Stores often had best-seller holes in one or more of their showrooms. This meant that the revenue normally produced from certain collections went unrealized. Depending on the time period, this could equate to thousands of dollars in lost sales from one collection alone. For example, the Napa Collection at Z-sales normally produced $50,000 during a 120-day period. They had a 30-day period of no display for this collection before they instituted family reporting. The cost of this missed opportunity was $416 per day or $12,500 for the 30-day period. Now that they review showroom display quantities on the family report, the chance of stock-outs has became much less likely.
In addition, all this new information enables Z-Sales’ merchandiser to increase her focus on the most important groups when doing floor-walks. Even though all collections should be displayed impeccably, the priority for display review should be top family collections first, followed by new product showings.
Tactic #6: Closeout non-producing families faster.
By looking at orange vs. green bars, it’s easy to see that the $1,199 Price Point is UNDER-performing while the $599 and $1,099 Price Points are OVER-performing. |
Merchandise line-ups always have a component of dog merchandise. Reviewing and reporting by family grouping enables Z-Stores to take a look at their bottom family producers. Pricing markdowns can be quickly triggered by a scan during a floor walk or report review daily or weekly, rather than monthly. In this way, the time for a non-producing family to be dropped from the line-up has been shortened, allowing for faster testing of new merchandise. Markdowns have become much more manageable as well.
Just because a family overall is producing top numbers, it does not mean that all SKUs in the family are selling. For example, if a collection’s loveseat has low sales compared with the rest of the family, that loveseat might be closed out or replaced with a different fabric option.
Conclusion
We’ve reviewed just a few of the advantages produced from improving processes and procedures using the power of family reporting. Looking at your merchandise in this way is an effective way of getting your arms around the ever-changing life cycles of inventory.
Fast forward to the current time: Z-Stores grew same store sales to $25 million, inventory grew to $5.3 million, gross margin grew to 48 percent and GMROI grew from $1.8 to $2.26. The switch to family methodology, new reporting processes and procedure was a success.
Although Z-Stores did improve considerably, their journey is just beginning. Operations like the Furniture Mall of Kansas and other great organizations in the performance groups I lead understand that real success is never-ending. To be effective, continual improvement practices should be conducted during the daily course of doing business. There will always be one family collection that is the hottest thing, and another family that falls from grace. Pay close attention, develop good processes and SOP’s, spot changes quickly, and take decisive actions.
About Jamie Winter: Jamie Winter is co-owner of Furniture Mall of Kansas and Tools2Win (www.tools2 winretail.com) a company that provides Purpose-built reporting tools. Please contact Jamie Winter at [email protected] or [email protected] for more information.
A word on software: Family and collection reporting should be configurable in most industry management software platforms such as those provided by PROFITsystems, Storis, Myriad, Furniture Wizard, Genesis and others. Purpose-built reporting tool suites that are integrated with the various platforms are available through Tools2Win and Furniture First’s Tools2BFirst programs.
About David McMahon: David McMahon is a retail financial and operational professional and Founder of PerformNOW. He directs multiple consulting projects, is proud to lead 6 business mastermind performance groups: Ashley Gladiators, Kaizen, Visionaries, TopLine Sales Managers, Lean and Sigma DC Operations. He is Certified Management Accountant and Certified Supply Chain Professional. You can connect with David at: https://www.linkedin.com/in/davidwmcmahon/ or [email protected].
