Published in:

Furniture World Magazine
Volume 149 NO.5 September/October


By David McMahon on 9/29/2019


This sales formula for growth will help you take actions that will directly impact the strength of your retail business.


One of the most common questions I get from my retailer clients is, “How are businesses doing out there?” They often add, “I’ve heard that it is tough for many retailers, business is flat, and few are growing.”

My response has remained pretty much the same over the past many years. Aside from during the great recession, many businesses in retail have been flat. However, there are some that have managed to grow significantly.

Why do some retailers grow, while others plateau or decline? This article will answer that question and hopefully help some of you get out of a rut and start to grow again.

The purpose of marketing is to increase customer engagement to then grow sales. Keeping that in mind, the most recent article in this series (July/ August 2019 issue, “Marketing Effectiveness Metrics Marketing“), looked at tracking customer traffic in three ways:

  • By new customers
  • By repeat customers
  • By personal trade repeat customers

Soon after the article was published, I heard a podcast interview with Kevin Systrom, the founder of Instagram. You can find it at (https://mastersofscale.com).

Systrom presented his formula for growth. “It’s how many new people came in the door, how many people decided to stop using you, and then how many people who used to use you decided to use you again. Plain and simple, those three terms equal net growth,” he said.

Given that it is difficult to track which customers “have left you and then decided to come back to you”, the idea presented in the previously mentioned July/August article of counting traffic as a driver of growth seems worthy. And, to make this traffic counting meaningful, retailers should track average sale and close rates by the three categories of traffic that are New Customers, Repeat Customers and Personal Trade Customers. The reasoning for this is that there are different strategies and likely different ROI’s depending on each customer relationship.

The Formula

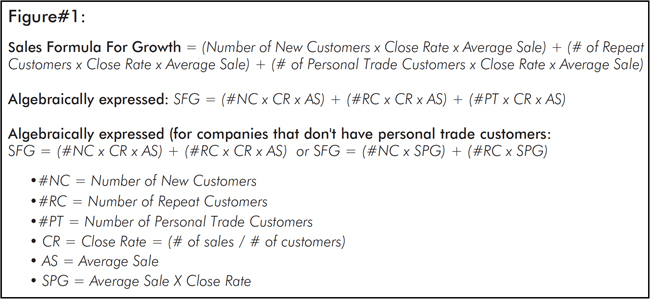
With all this in mind, my sales formula for growth is expressed in Figure #1 below.

This is in contrast to how many retailers in our industry measure growth. They use the simple formula for change: (Sales Now – Sales Before) / Sales Before. This is OK, however, by just using this change formula, the underlying reasons for growth remain mostly guess work.

Salespeople & Capacity

Most furniture retailers’ business models rely exclusively on salespeople serving customers. Experience has shown that individual salespeople can improve but, as a whole, a sales force can do so only marginally. This has to do with capacity. The capacity per salesperson is the average sales per salesperson dictated by your business model. Sure you may have a person who writes $1.5 million per year. But, you likely cannot find a way to bring everyone on your sales team up to that level. It’s just not the way averages work. With this in mind, if you have five salespeople and your average is $650,400 per salesperson, your sales are $3.25 million per year.

Yes, you can improve. However, those retailers that really grow their furniture businesses, add additional salespeople, find ways to get them customers, and achieve the same or better sales / salesperson averages.

Those retailers that really grow their furniture retail businesses, add more salespeople to their companies, find ways to get them customers, and achieve the same or better sales/ salesperson averages.
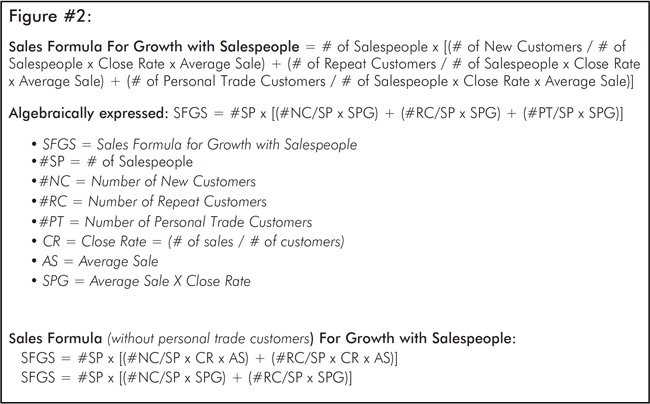
Expanded Formula

Since sales force growth is integral to company growth, the “sales formula for growth” is amended in Figure #2 above to include the number of salespeople. Also, if you prefer to track sales per guest (SPG), you can substitute SPG for AS x CR (average sale x close rate in Figure #2.

Ways Businesses Grow

Before you start making predictions on the economy, or the internet and the way people shop (which do play a part, but in which you have little control), consider these 5 questions:

  1. Has the number of salespeople you employ grown?
  2. Has the number of stores you operate or categories you offer expanded?
  3. Has your business model been improved?
  4. Has the mix of your team been improved?
  5. Have your management team and systems improved?

Adding one salesperson,
and taking steps to increase the average monthly sales per salesperson helped this business go from habitually flat to growing.


When “no” is the answer to many of these questions, you are unlikely to have experienced substantial growth.

Another factor that affects business growth is when other businesses decide to grow in your market area before you. When competitors for your customers’ share-of-spend are answering “yes” to the above five questions, they will hurt your growth potential.

Below is a list of some actions that commonly result in growing volume:

  • Adding salespeople and staffing properly to existing traffic
  • Adding salespeople and staffing properly to desired sales goals
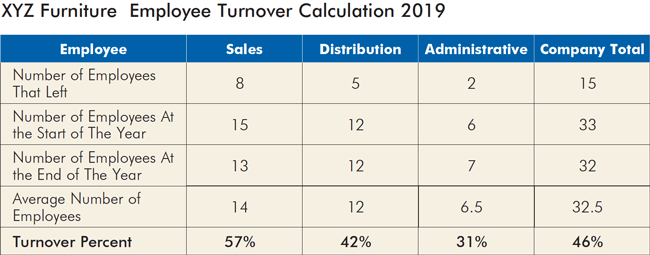
  • Decreasing employee turnover
  • Adding retail locations
  • Adding categories
  • Adding new marketing programs
  • Increasing customer follow-up
  • Changing the business model
  • Changing employees
  • Changing managers
  • Changing locations
  • Changing the marketing mix
  • Changing merchandising and/or display presentations
  • Changing and improving on systems and procedures to make selling easier.

Aside from decreasing employee turnover, all the growth actions start with add, change, increase, or improve. There are few actions that would result in sales growth that start with cut, reduce, do less, or do the same thing.

Case Example

Let’s look at a quick case example and apply my sales formula for growth with salespeople (SFGS). Let’s take the case of a business we will call XYZ, stuck at $3.25 million dollars in annual sales volume. This furniture retailer employed five salespeople on average, was good at counting traffic and had a functioning opportunity counting system that tracked close rates, average sales, and SPG by customer type. The company had tried sales training, changing managers, tweaking their selling system and changing up the marketing mix. These actions moved the needle initially. But eventually, they ended up right back where they started. The sales training seemed to have little effect on results in the long run because salesperson turnover was too high. Year after year they could not beat an average sales number of $650,000 per year, $54,000 per month per salesperson. Finally, XYZ’s owner decided enough was enough and did three things:

  1. Mandated and managed the use of a selling system that was part of the sales training they invested in.
  2. Increased and systematized their customer follow-up.
  3. Added 1 salesperson (averaged 6 at all times).

After one full year of operating this way, this is what happened:

Customer traffic increased by 50 people per month and salesperson turnover dropped. The store’s average salesperson per guest metric improved. The average monthly sales per salesperson increased marginally from $54,000 per month per salesperson to $56,000. Annual sales per salesperson increased from $650,000 to $672,000 per year. These steps helped this business grow from $3,252,500 million in sales to $4,032,000. That’s a 24 percent increase in sales volume (See Chart #1 below).

For retailer XYZ, adding one additional salesperson and taking steps to increase the average monthly sales per salesperson helped this business go from habitually flat to growing.

Improvement starts with understanding your situation better, making decisions to improve that situation, and then executing those improvement actions.


David McMahon is a retail financial and operational professional and Founder of PerformNOW. He directs multiple consulting projects, is proud to lead 6 business mastermind performance groups: Ashley Gladiators, Kaizen, Visionaries, TopLine Sales Managers, Lean and Sigma DC Operations. He is Certified Management Accountant and Certified Supply Chain Professional. You can connect with David at: 

https://www.linkedin.com/in/davidwmcmahon/ or david@performnow.net


Furniture World Magazine
Volume 149 NO.6 November/December


By David McMahon on 12/7/2019


Tracking employee turnover will lead to greater sales and profit. It will, over time, create a vastly better organizational culture.


We can’t find good people!

People don’t stay around long.

The time to get a new employee up to speed seems too long.

My sales are flat because I don’t have enough people.

I get too many customer service issues due to mistakes.

These are statements I regularly hear from individual clients and in performance groups. Finding and keeping good employees are top challenges for retail business owners, sales managers, and warehouse operations managers.

To show this equation in action, let’s look at a company we will call XYZ Furniture that has three major departments: Sales, Distribution, and Administration.

I think we all can agree that lowering employee turnover is extremely beneficial to any business. However, when business owners are asked what their turnover percentage is, they usually give general answers such as, “Too Much!” When sales managers and warehouse managers are asked what their departmental turnover percentage is, they often respond with blank stares. They have no idea or just guess.

Can you imagine, if an owner was asked the question, “What is your net profit margin?”, and the answer was, “not enough”, or, “I don’t know”? Turnover is a critical business metric just like profit margin and yet it is largely untracked. In fact, turnover directly impacts sales and gross margin. So, if you want to improve sales, profitability, and cash flow, start by measuring employee turnover.

Measurement

There are theories and excuses regarding how turnover should be measured. Some say that it should only be measured for employees who remain employed for more than a couple days, for example. To me, that may be fudging the numbers to cover up poor hiring practices.

Here is a simple and accurate equation to use. Calculate the number of employees who left over a certain time period, divided by the average number of employees for that time period, expressed as a percentage.


Employee Turnover percent, for a period of time = employees who left or were let go for any reason / [(Employee number, at the start + Employee number, at the end) / 2)] x 100.


To show this equation in action, let’s look at a company we will call XYZ Furniture that has three major departments: Sales, Distribution, and Administration.

The table below lists the annual number of employees for a 10 million dollar company and the corresponding turnover rate. The highest turnover is the Sales department with a 57 percent turnover. They had eight salespeople that left the business during the course of a 12-month period. Three were let go and five quit. They started with 15 salespeople and now have 13, so there is an average staff size of 14 salespeople.

The other departments fared a bit better with 42 percent turnover in the DC and 31 percent in administration. The company total is 46 percent. You might think this is terrible. I agree. Unfortunately, it is a common and a totally realistic retail example. The National Retail Federation reports that according to a survey, employee turnover was 60 percent in 2018. The national average across all industries is 15 percent according to a separate study by Compensation Source. From my personal experience with performance groups and retail consulting clients, the companies with the lowest turnover are at 20 percent. Only a few are under that, and the highest are at 100 percent!

The Cost Per Employee

To illustrate the costs of turnover, let’s consider the sales department illustrated in the chart on the previous page for XYZ Furniture.

Search and hiring costs: This includes the use of sites such as Indeed, Monster, Linkedin and Timetohire. Also, recruiting agencies, plus digital and traditional advertising. Add to that any referral and signing bonuses paid. There are also costs for background checks and drug screening. And, don’t forget the hidden costs of time. Managers need to spend time reading resumes, making calls and interviewing. The cost might be between $1,000 and $10,000 per new employee.

Onboarding and training costs: This will include a fixed salary paid to new commissioned sales associates until they produce enough sales volume to cover their draw. There are also payroll and HR set-up costs. New sales employees typically need four to eight weeks to become productive. And, add to this precious time spent by management and senior salespeople who must mentor new employees. My cost estimate for onboarding and training for XYZ Furniture is between $6,000 and $10,000 per employee.

The companies with the lowest turnover are at 20 percent. Only a few are under that, and the highest are at 100 percent!

Loss of sales costs: This is an economic opportunity cost that is difficult to quantify. The cost of lost revenue is hidden. It is, in my opinion however, the costliest issue with turnover. In this example eight salespeople left. Five of those quit. That means five people may have been producing adequately, since the company did not let them go. The time lag between when an employee leaves to when his or her replacement is hired and becomes productive, can be between one and three months or more. During this time, either all other salespeople need to step up their level of productivity, or customers will go under-served and unsold. Generally, sales per individual salesperson does not increase much when people leave, so furnishings retailers experience a dip in sales during turnover periods. In the case of XYZ Furniture’s sales department, the number of employees at the start of the period (15) was more than at the end of the period (13). So, it’s likely that the total sales volume fell. My estimate of the cost of lost sales for this business is between $50, 000 and $150,000. At cost less variable selling expenses (cost of goods, commissions, credit fees), the business would lose between $20,000 and $60,000 per turned over employee.

The total cost of turnover: Based on the previously given cost estimates for employee search, hiring, onboarding, training and loss of sales, the cost of turnover per salesperson for XYZ Furniture could be between $26,000 and $80,000.

I don’t think there will be any debate that if this company were to apply resources to cut turnover, it would increase its profitability. In this example, if it was able to keep three of the five good sales employees who left, it could add $78,000 to $240,000 to its bottom line. At $10 million in revenue, the median profitability increase would be 1.62 percent.


Start tracking by department each month for the prior 12 months. Establish your benchmark over a few months of tracking. Then define and implement improvement actions.


Actions to Decrease Turnover

Searching Google will reveal many articles and books written on each one of the following actions. Here is a quick list of some top considerations as they apply to our industry:

  1. Hire Well. Getting it right on the front end will save money and disruption down the road. This goes both ways, because sometimes the right hire is passed over due to poor interviewer recognition of talent or a clash of personalities.
  2. Train to Succeed. An organized and effective success system needs to be put in place. Retailers often complain that the person they hired is “not the same person” they interviewed. My question back is, “Were the promises you made to the candidate during the interview process fully realized?”
  3. Employee Buy-in: Ensure existing employees are 100 percent committed to helping new employees succeed. Do not allow intimidation from current employees. “Scaring off” new hires is rampant in this industry, especially among salespeople.
  4. Management Leadership: Ensure your managers are also leaders. Management and leadership are different. The best are able to do both. Higher turnover will result from managers who are lacking in leadership abilities.
  5. Employee Values: Good people only want to work with others who share similar values. Build a team with people who have workplace attributes that will complement and be well received inside your organization.
  6. Salary & Growth: Pay competitively and show your employees a path for advancement and increased compensation.
  7. Elevate Learning. Minds must be stimulated. Employees will get restless if there are scant opportunities for mental stimulation and career advancement. If you hire people who are motivated to succeed in your organization and give them the necessary tools, you will keep the employees you want to keep.
  8. Reviews & Meetings: Conduct performance reviews and improvement meetings separately. Combining these can have negative effects.
  9. Grow Your Business. People want to be a part of growing companies. If you want to attract and keep the best talent in your industry, you must be among the best yourself.
  10. Remove Bad Attitudes. Firing employees who have bad attitudes will increase your turnover numbers in the short term but lower them in the long run.

The Process

Employee turnover is one of the most important retail business metrics and yet it is rarely tracked. First, start tracking by department each month for the prior 12 months. Establish your benchmark over a few months of tracking. Then, define and implement improvement actions. If you make this work, you will not only find that you have less turnover and greater sales and profit, you will also build a much-improved organizational culture.


David McMahon is a retail financial and operational professional and Founder of PerformNOW. He directs multiple consulting projects, is proud to lead 6 business mastermind performance groups: Ashley Gladiators, Kaizen, Visionaries, TopLine Sales Managers, Lean and Sigma DC Operations. He is Certified Management Accountant and Certified Supply Chain Professional.

You can connect with David McMahon at: 

https://www.linkedin.com/in/davidwmcmahon/ or david@performnow.net